
In our previous blogpost, we touched upon the definition of Financial Statement Fraud, and some key detection, prevention and investigation techniques. Today, we dig deeper to using financial ratios as a detection method.

A) Introduction to Financial Ratios
Financial ratios are quantitative measures derived from financial statement data. They provide insights into a company’s performance, efficiency, and financial health. Ratios are valuable tools for analysts, investors, and auditors to assess whether the financial statements reflect the true economic condition of the business. Key financial ratios include liquidity ratios, profitability ratios, leverage ratios, and efficiency ratios.
B) Common Financial Ratios and Their Relevance
1. Liquidity Ratios
Liquidity ratios measure a company’s ability to meet its short-term obligations. Common liquidity ratios include:
– Current Ratio: Current Assets / Current Liabilities
– Quick Ratio: (Current Assets – Inventory) / Current Liabilities
Significant deviations from industry norms in these ratios may indicate potential manipulation of asset and liability balances.
2. Profitability Ratios
Profitability ratios assess a company’s ability to generate earnings relative to its revenue, assets, and equity. Key profitability ratios include:
– Gross Margin Ratio: Gross Profit / Net Sales
– Net Profit Margin: Net Income / Net Sales
– Return on Assets (ROA): Net Income / Total Assets
– Return on Equity (ROE): Net Income / Shareholders’ Equity
Unusual profitability ratios, such as abnormally high or low margins compared to industry peers, can be a red flag for revenue or expense manipulation.
3. Leverage Ratios
Leverage ratios indicate the level of a company’s debt relative to its equity and assets. Important leverage ratios include:
– Debt-to-Equity Ratio: Total Liabilities / Shareholders’ Equity
– Interest Coverage Ratio: Earnings Before Interest and Taxes (EBIT) / Interest Expense
A sudden improvement in leverage ratios without a clear business reason may suggest off-balance-sheet financing or underreporting of liabilities.
4. Efficiency Ratios
Efficiency ratios measure how effectively a company utilizes its assets and manages its operations. Common efficiency ratios include:
– Inventory Turnover: Cost of Goods Sold / Average Inventory
– Accounts Receivable Turnover: Net Credit Sales / Average Accounts Receivable
Anomalies in efficiency ratios, such as low inventory turnover, may indicate inventory manipulation or improper revenue recognition.
C) Detecting Financial Statement Fraud with Financial Ratios

1. Benchmarking: Compare the company’s financial ratios against industry standards and historical performance. Significant deviations should prompt further investigation.
2. Trend Analysis: Analyze trends over multiple periods to identify sudden changes or unusual patterns in ratios. Consistent improvement or deterioration in specific ratios without a corresponding business justification may indicate fraud.
3. Cross-Verification: Cross-verify financial ratios with other financial statement components. For instance, an increase in sales should correlate with an increase in accounts receivable and inventory levels.
4. Variance Analysis: Conduct variance analysis to identify unexpected changes in ratios. Investigate significant variances that lack clear explanations or supporting documentation.
D) Examples of Ratio Analysis in Detecting Fraud
Consider a company with the following unusual changes in its financial ratios:
– Sudden Increase in Gross Margin Ratio: The company’s gross margin ratio significantly increases without a corresponding rise in sales volume or reduction in production costs. This may suggest fictitious revenues or understated costs.
– Decline in Inventory Turnover: The inventory turnover ratio drops dramatically, indicating that the company is holding onto inventory longer than usual. This could be a sign of inflating inventory values to boost asset balances.
– Improved Current Ratio: The current ratio improves sharply due to an increase in accounts receivable, but sales remain flat. This may indicate revenue recognition fraud, where sales are recorded before they are earned.
Hypothetical Example: Detection of Financial Statement Fraud through Current Ratio Analysis
Company Background:
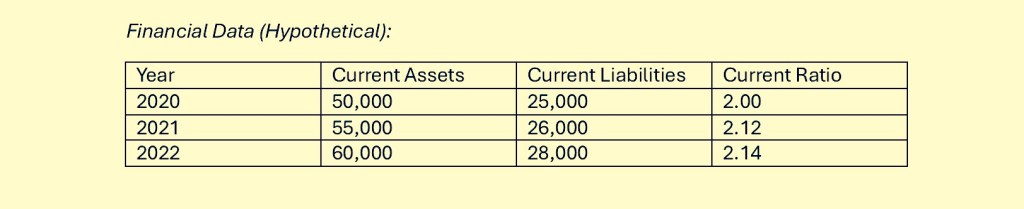
Let’s consider a hypothetical Company, which operates in the manufacturing industry. We will analyze its financial statements over three consecutive years (2020, 2021, and 2022) using the current ratio.
Analysis:
In the years 2020 and 2021, Company has a relatively stable current ratio of 2.00 and 2.12, respectively. This indicates that the company has maintained a consistent ability to cover its short-term liabilities with its short-term assets. However, in 2022, despite an increase in both current assets and current liabilities, the current ratio shows only a slight increase to 2.14.
Suspicious Observation:
To understand the implications better, we can conduct a deeper analysis. Let’s assume we obtained additional information showing a sudden and unusual increase in current assets for 2022 without a corresponding increase in sales or operational activities:
Red Flag:

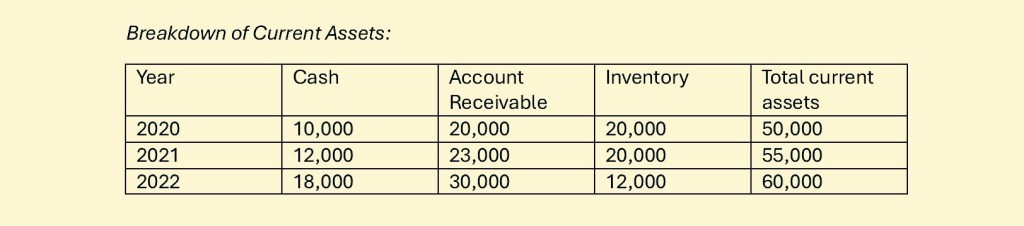
In 2022, there is a significant increase in cash and accounts receivable but a decrease in inventory. This is unusual because:
– Cash increased by 6000, from 12,000 to 18,000.
– Accounts Receivable increased by 7,000, from 23,000 to 30,000.
– Inventory decreased only by 8,000, from 20,000 to 12,000.
In financial analysis, certain patterns of changes in the balance sheet components can signal potential fraudulent activities. Specifically, the combination of an increase in cash and accounts receivable with a decrease in inventory warrants closer scrutiny as this may indicate below financial statement fraud risks:
1) Fictitious Sales and Revenue Recognition Fraud
– The increase in accounts receivable suggests more sales were recorded.
– The decrease in inventory suggests these sales reduced the stock, but the cash inflow (although increased) does not fully correspond to a proportional increase in genuine sales activity.
2) Channel Stuffing
– The significant inventory drop might indicate the company is pushing more products to distributors or recognizing sales before actual transactions are finalized.
3) Understated Liabilities or Overstated Assets
– The increase in cash could be part of a scheme to show improved liquidity. If these cash receipts are not supported by genuine sales, it indicates fraudulent inflow reporting.
Investigation Steps:

So, what to do next to fully uncover the mystery around Company’s hypothetical 2022 figures?
1. Review Sales Invoices: Verify the authenticity of sales invoices and check if the recorded sales are valid.
2. Confirm Accounts Receivable: Contact major debtors to confirm the existence and amounts of receivables.
3. Inventory Audit: Conduct a physical inventory count to ensure inventory records match actual inventory.
4. Check Cash Transactions: Review bank statements and cash receipts to ensure they correspond to actual business activities.
E) Conclusion
Financial ratios are powerful tools for detecting financial statement fraud. By systematically analyzing and comparing these ratios against industry benchmarks and historical data, auditors and analysts can identify red flags and anomalies that warrant further investigation. Implementing robust ratio analysis as part of a comprehensive fraud detection strategy enhances the likelihood of uncovering deceptive financial practices and ensuring the integrity of financial reporting.

Leave a comment