
In our previous blogposts, we touched upon many topics related to ESG, including the definition of ESG risk, auditing strategies and also EBA report to a related risk, Greenwashing. Now, we would like to make an analysis of the current state of the sectors, based on a dataset publicly available. The dataset used in this analysis is S&P’s ESG Risk Score of the S&P 500 companies as of 30th January 2023. Although it is the figures from last year, they give an indication about important dimensions for each sector. The main outcomes from our side are as below – Let us know your comments and questions.
- All sectors need to enhance their relevant frameworks and policies,
- Environmental risk dimensions seems to be at the lower end for certain important sectors, concerning the reachability to global ESG goals,
- Social risk dimensions needs to be enhanced for technology sector – the sector itself grows steadily, but what about the employees and society?
- Regulatory landscape should be improved for the other sectors, apart from the ones heavily regulated. For a very long time legislation is built for Financial Sector and healthcare, but now its time to focus on Technology and Communications, for instance.
S&P’s ESG Risk Score Methodology:
The S&P Global ESG Score measures a company’s performance on and management of material ESG risks, opportunities, and impacts informed by a combination of company disclosures, media and stakeholder analysis, modelling approaches, and in-depth company engagement via the S&P Global Corporate Sustainability Assessment (CSA).
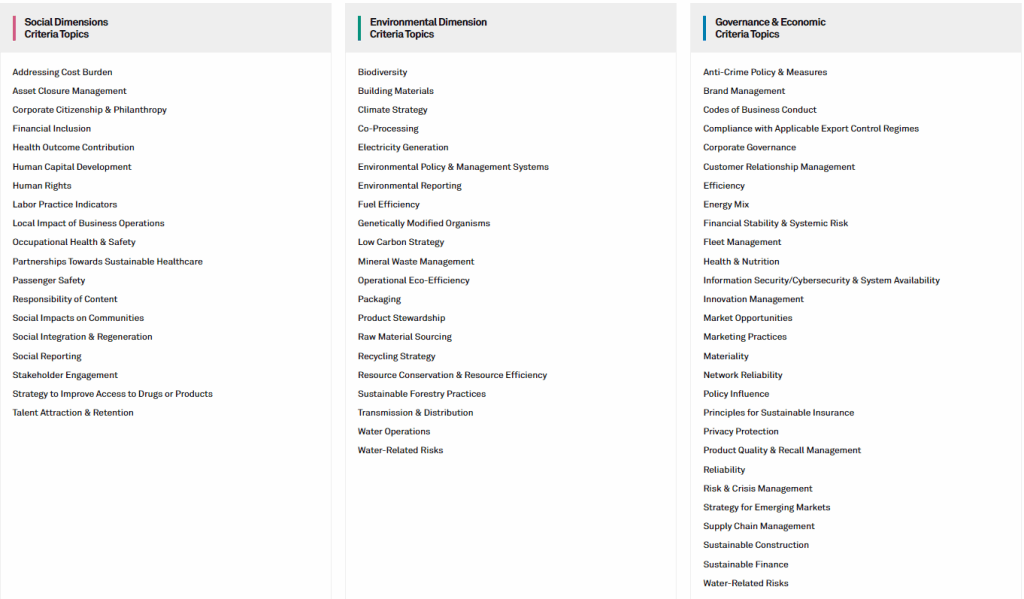
S&P Global ESG Scores are measured on a scale of 0 – 100, where 100 represents the maximum score. Points are awarded at the question-level, with an average of 130 per company, based on our assessment of up to 1,000 underlying data points according to pre-defined scoring frameworks that assess their availability, quality, relevance, and performance on sustainability topics. The breakdown of these topics are as below, per S&Ps website:
Analysis of ESG Scores per sector

The chart above shows the average Total ESG Risk Scores across various sectors. Technology and Healthcare sectors exhibit some of the highest average ESG risk scores, however their average is towards the lower side of the graph. On the other hand, Basic Materials and Utilities sectors tend to have lower average ESG risk scores, whereas the average of all companies in the analysis tend to be on the higher end of the graph. This shows that all sectors need to enhance their risk management frameworks and processes.
So, which areas to focus on for which sector?
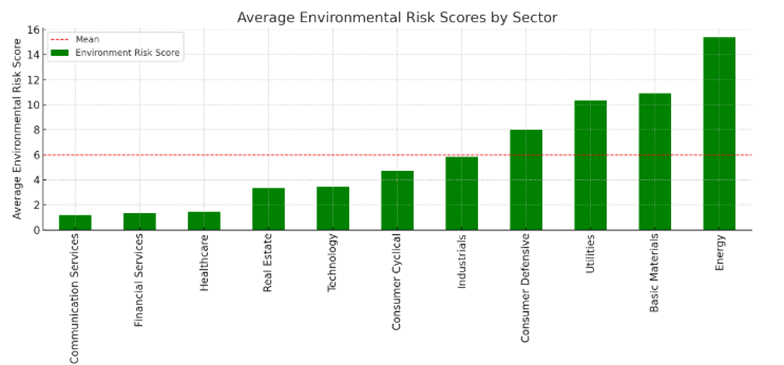
Communication Services, Financial Services and Healthcare got lowest scores for Environmental risk dimensions. Having a climate, environment and low carbon strategy should be number one priority for the companies in these sectors.
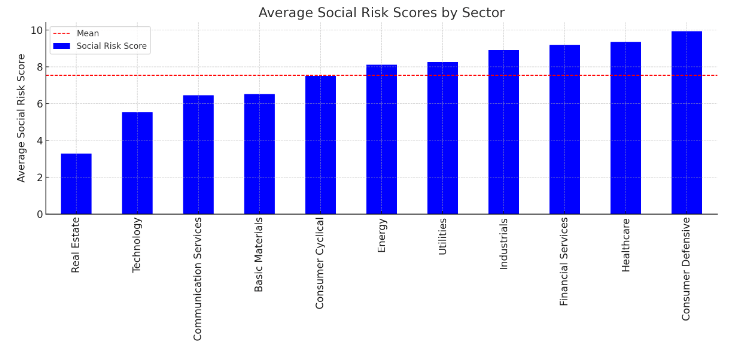
Real Estate and Technology sectors have the lowest social risk score. Human Capital development, labour practices, social responsibility and local impact should be an area to focus for these sectors.
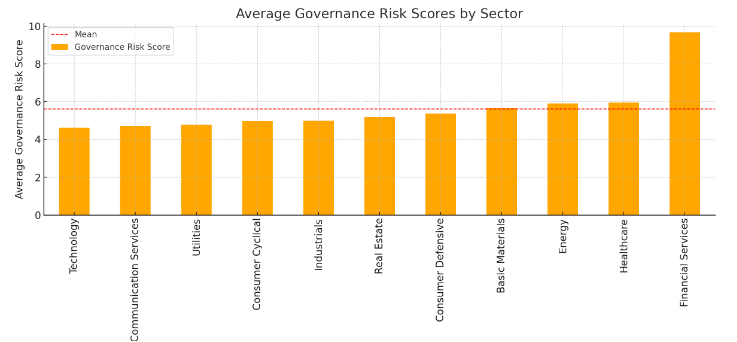
As expected, governance part is pretty much steady for each sector, with a jump for financial services and healthcare. No need to say that these sectors are highly regulated sectors. This also gives the message to legislators that regulation is needed for all sectors, especially for technology and communications, which affect the society most at even individual level.
For more detailed analysis per sector:
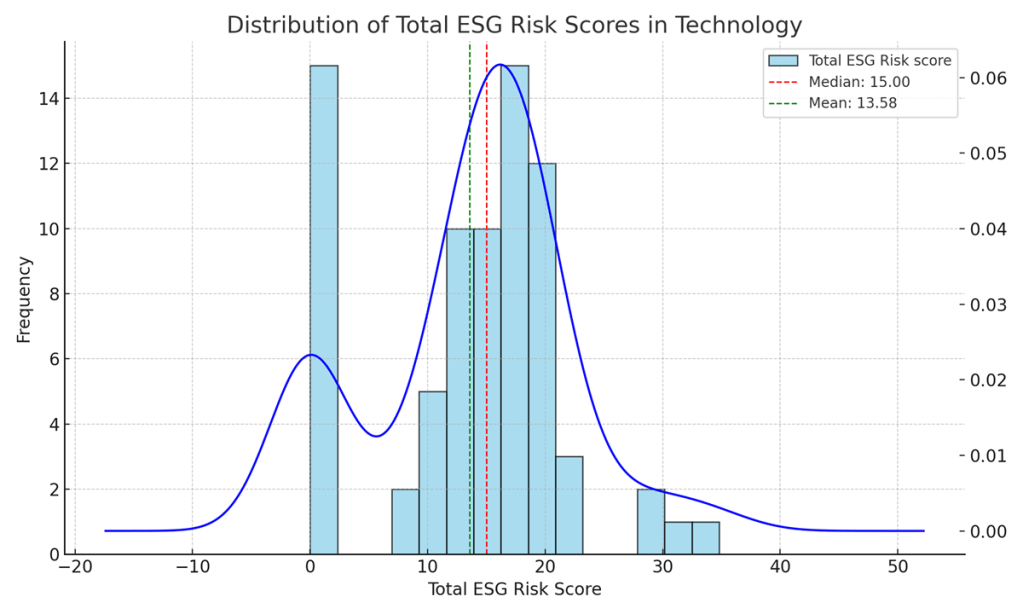
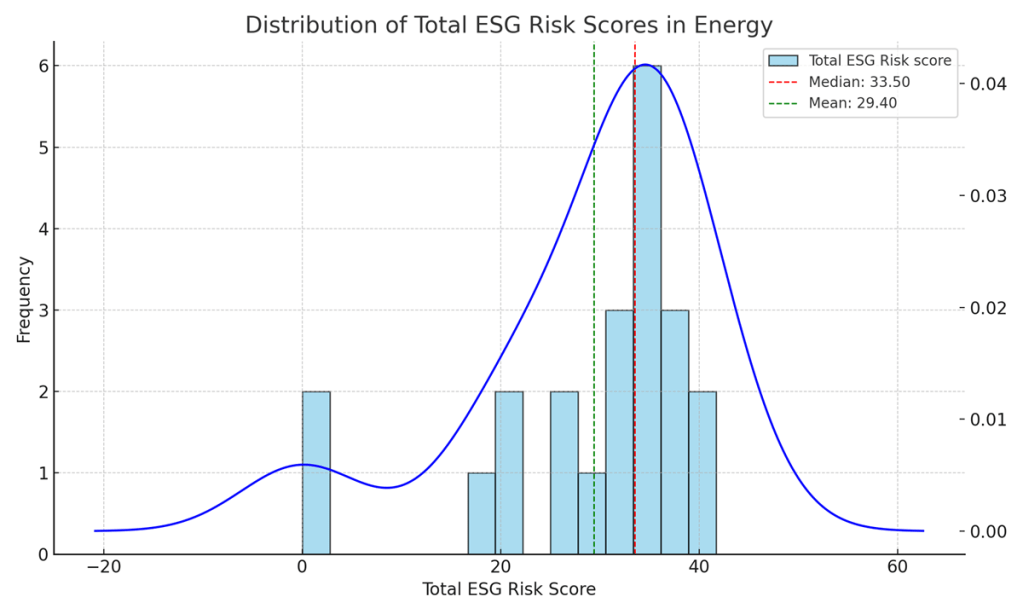
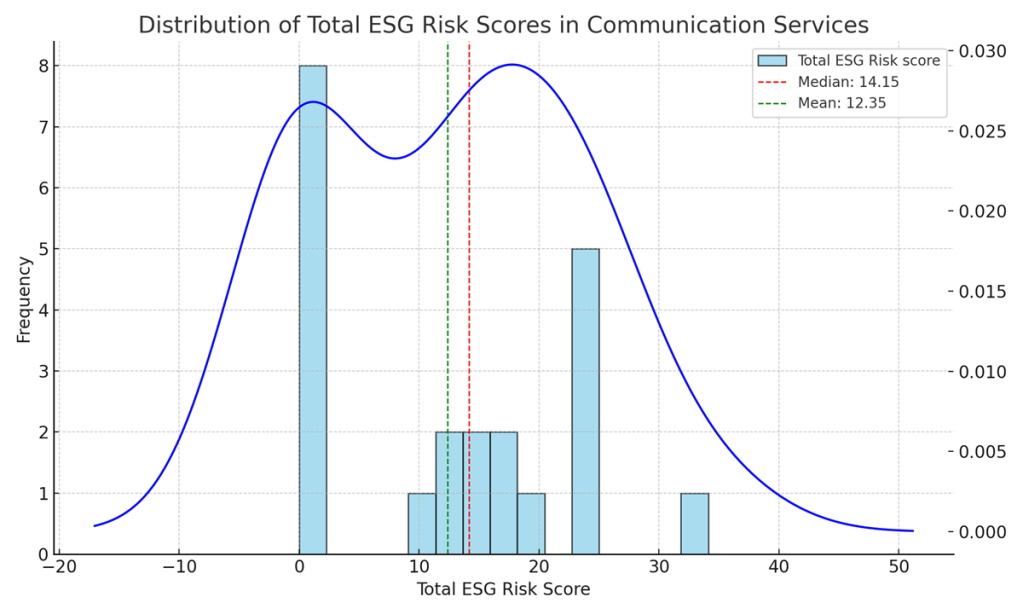
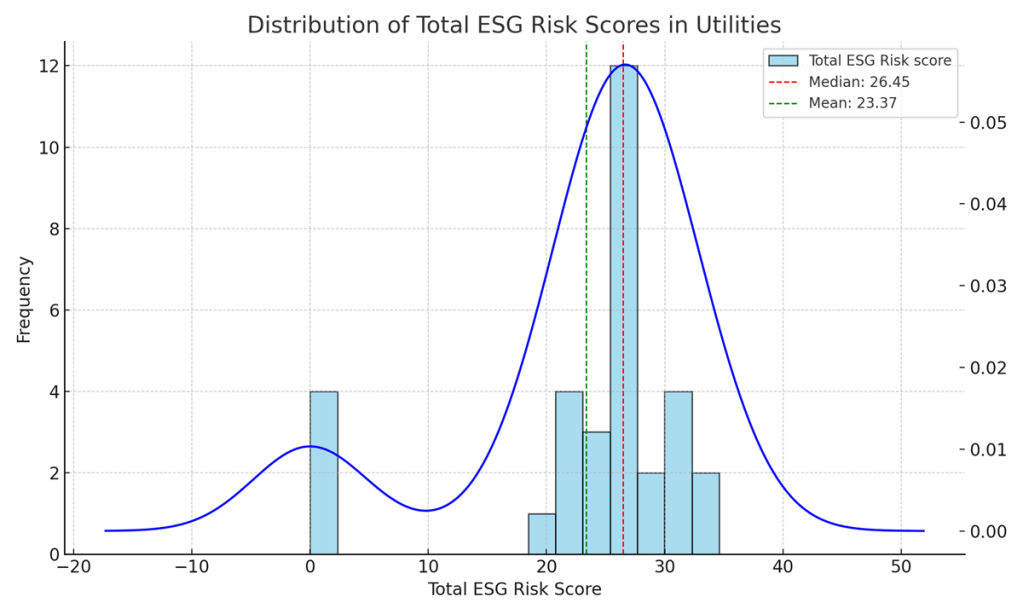
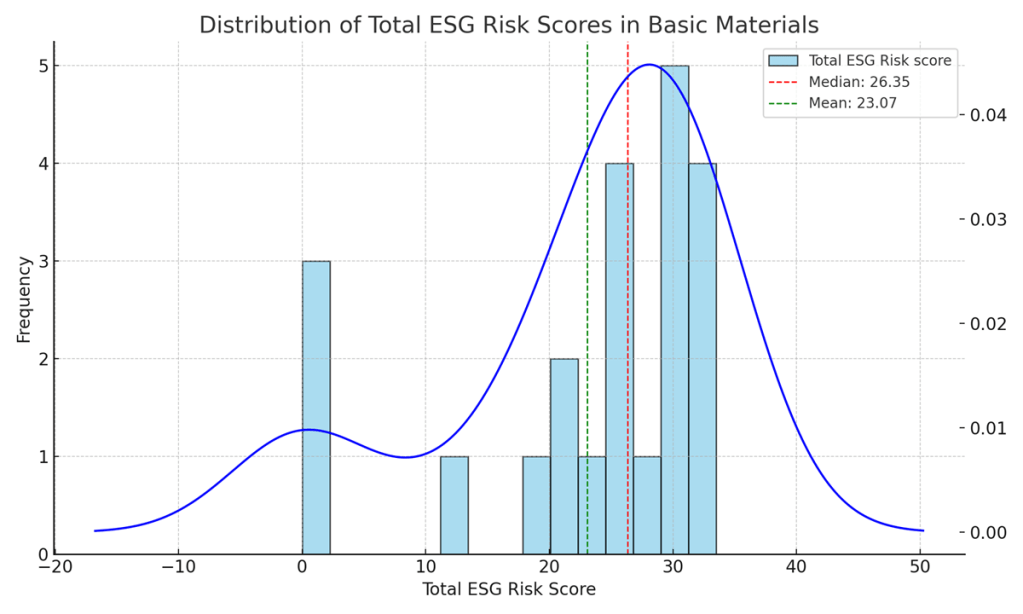
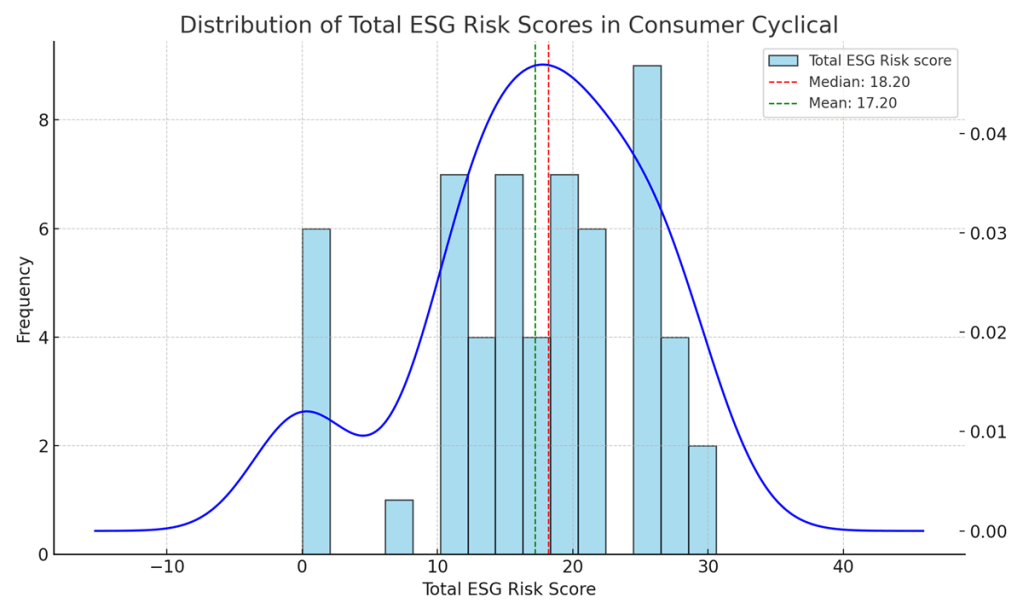
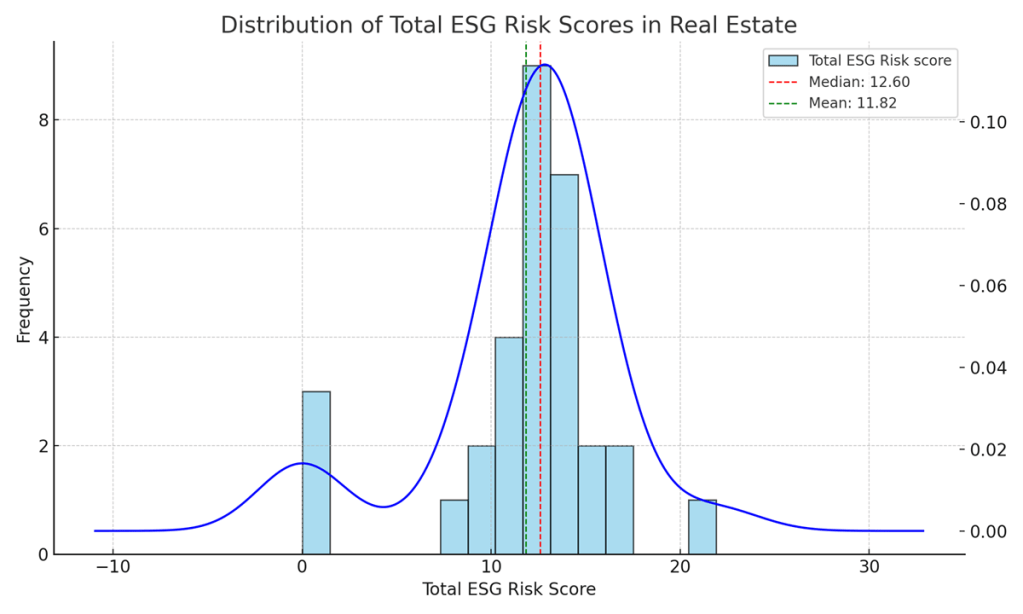
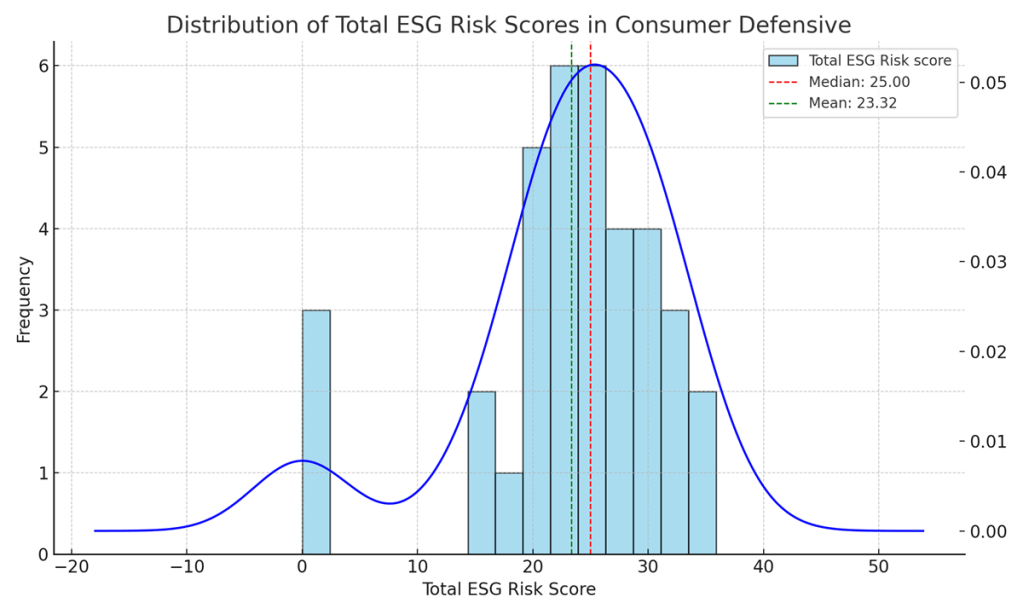
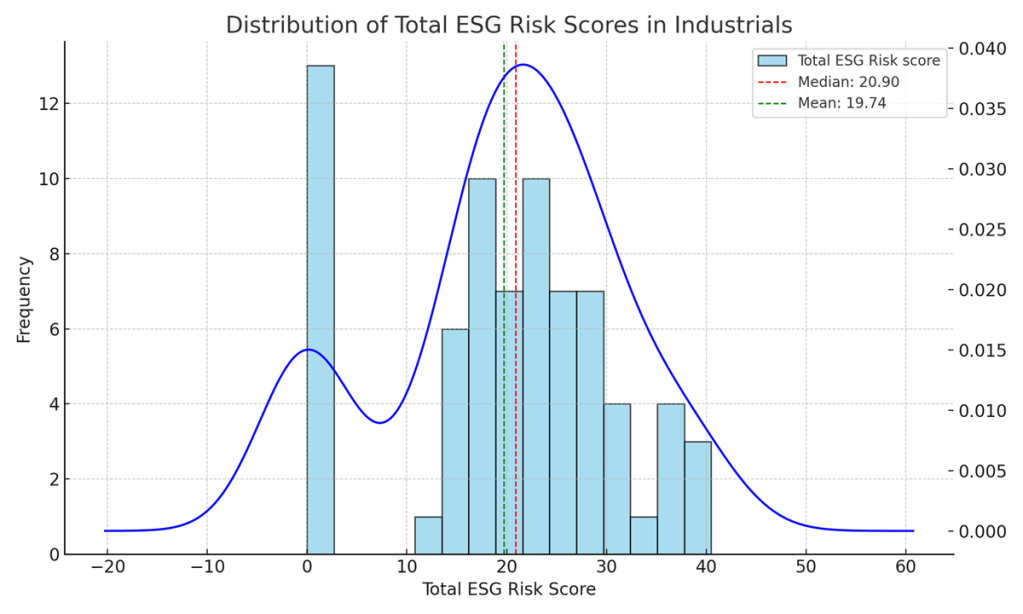
The charts below shows the distribution of Total ESG Risk Scores in various sectors. The red dashed line indicates the median score, and the green dashed line indicates the average score. This helps understanding the spread and central tendency of the ESG scores within each sector.


Leave a comment